A fast Fourier transform (FFT) of the image is shown. A circular ring reflects the periodicity of the D-band spacing. This ring in the FFT is also broken reflecting the fiber orientation. Most of the intensity is between 11 and 1 o'clock as this reflects the orientation of the fibers with this D-band period. Another portion is around 2 o'clock representing the fibers at the top of the image that are diagonal in the image field. This is one useful application of the FFT: quantitating the orientation of structures in the image field.
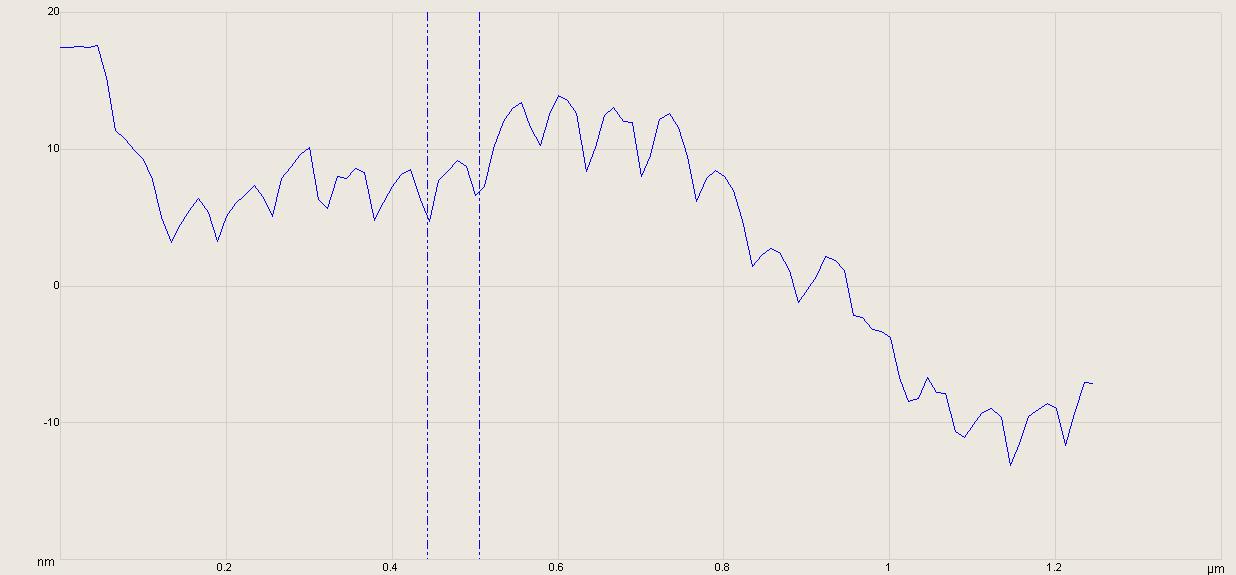
The second image is 2D isotropic power spectral density. This reflects the power of image signal strength as a function of spatial frequency. The first maximum is at 64 nm and reflects the D-band spacing. As this includes spatial frequency information from the entire image, this is a much more robust method of estimating the D-band spacing than manually sectioning a couple D-band in an image.